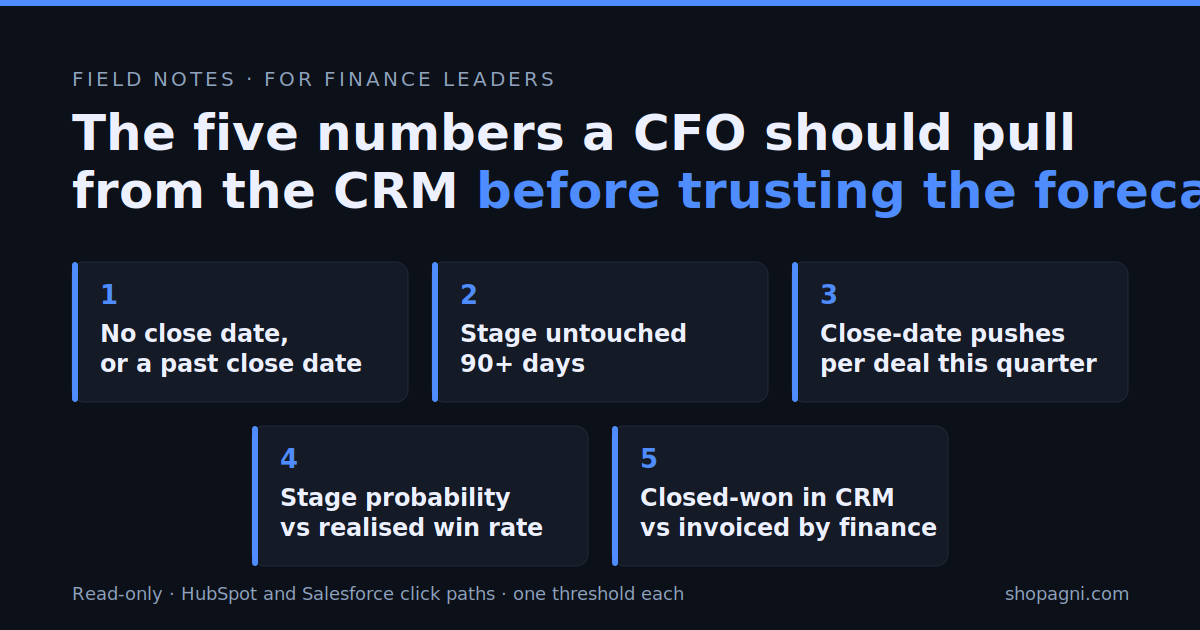
A CFO who does not trust the pipeline number can usually find out why in an afternoon, without asking sales or marketing for anything. Five exports from the CRM, each returning a row count and a dollar figure, show whether the forecast is built on records that mean what they claim to mean. Below: the five, the report to pull in HubSpot and Salesforce, the threshold that should worry you, and what a bad result says about the system.
The context flatters nobody. Gartner’s August 2025 survey of more than 200 CFOs found that 51% rank improving forecast accuracy and quality in their top five priorities for 2026. Gartner’s sales-operations survey found only 45% of sales leaders and sellers had high confidence in their own forecast. And a Perion and Advertiser Perceptions survey of 167 senior marketers in autumn 2025 found only 22% strongly felt they had the data to justify marketing’s value to their CFO.
These are the five we pull first when the brief is “the board deck and the CRM export disagree,” in the order that lets each narrow the next.
1. Open opportunities with no close date, or a close date in the past
What it is. The count and value of open opportunities where the close date is blank or earlier than today. A forecast is a sum of dated commitments; an undated or past-dated deal is a placeholder that has been allowed to stay in the total.
HubSpot. CRM > Deals, table view. Filter Deal stage is any of your open stages, then Close date is before today; run a second view with Close date is unknown. Actions > Export with Amount, Owner and Pipeline.
Salesforce. Reports > New Report > Opportunities. Filters: Closed equals False, Close Date less than TODAY. Group by Owner, summarise Amount, Export > Details Only. Close Date is required by default, so if a blank-date report returns rows, someone removed the requirement or is loading records through the API.
The threshold. More than 10% of open pipeline value with a past-due or missing close date.
What it usually means. Not laziness. Nothing in the CRM forces a close-date decision when a deal stalls, so the cheapest action is to leave it. The fix is a stage-exit rule or a weekly past-due queue with an owner, not a memo.
2. Open opportunities with no stage change in 90 days or more
What it is. Open deals whose stage has not moved in 90 days. A deal that has sat a full quarter in one stage is either dead or mis-staged, and both distort the weighted forecast.
HubSpot. Every pipeline stage carries two automatic properties, Date entered [stage] and Time in [stage]. In CRM > Deals, filter open stages and set Date entered for each stage to more than 90 days ago, then export.
Salesforce. Use the standard field Last Stage Change Date. Reports > New Report > Opportunities, filter Closed equals False and Last Stage Change Date less than LAST 90 DAYS, group by Stage, summarise Amount.
The threshold. More than 20% of open pipeline value untouched for 90 days or more. If most of it sits in your two latest stages, treat it as worse: that is the pipeline the forecast weights most heavily.
What it usually means. No stage has a written exit criterion, and nobody is paid to close-lose a deal. A stage without exit criteria is a description, not a gate. This is the number that most reliably turns an engagement toward rewriting stage definitions rather than fixing reports.
3. Close-date pushes per deal this quarter
What it is. How many deals dated for this quarter have had the close date moved out, and how many times. This is the number most finance leaders never pull, because it is not a property on the record; it lives in the field history. A deal pushed twice is telling you the close date was never a forecast.
HubSpot. The quick route is Reporting > Reports > Sales analytics > Deal push rate, which shows the share of deals whose close date moved to a later period and drills to the list. The complete route is Settings > Objects > Deals > Manage deal properties, open Close date, and Export property history: one row per change with a timestamp. Filter to this quarter’s changes where the new date is later than the old one and count by Deal ID.
Salesforce. The Opportunity History report type already captures close-date changes. Reports > New Report > Opportunity History, filter Closed equals False, add the From Close Date and To Close Date columns, group by Opportunity Name. Rows per opportunity where the To date is later than the From date is your push count. With field history tracking on for Close Date (Setup > Object Manager > Opportunity > Set History Tracking), the Opportunity Field History report adds who made each change.
The threshold. Any deal pushed three or more times in a quarter comes out of the commit view until someone has spoken to the buyer. At the portfolio level, if more than a quarter of this quarter’s dated deals have already been pushed once, the quarter-end number is being managed rather than forecast.
What it usually means. A close date that costs nothing to move. Require a reason picklist on close-date change and report on the reasons. The first month of reasons is usually more informative than a year of pipeline reviews.
4. Stage probability versus the realised win rate from that stage
What it is. Every CRM weights the forecast by a probability attached to each stage. Salesforce ships defaults from 10% up to 90%; HubSpot uses whatever the person who built the pipeline typed in. The number to pull is the actual share of deals that reached each stage in the last four quarters and went on to close won. If the stage says 60% and history says 31%, that stage is overstated by roughly half.
HubSpot. Configured probabilities are in Settings > Objects > Deals > Pipelines, on the stage list. For the realised rate, Reporting > Reports > Sales analytics > Deal stage funnel, date range last four quarters, and read the cumulative conversion to Closed won next to the configured probability for each stage.
Salesforce. Setup > Object Manager > Opportunity > Fields & Relationships > Stage shows the configured probability per stage. For the realised rate, Reports > New Report > Opportunity History, filter Close Date within the last four quarters, group by To Stage, and compute the share of opportunities that entered each stage and later appear as Closed Won.
The threshold. Any stage where configured probability and realised win rate differ by more than 15 points. Late stages matter most; a 20-point gap at Negotiation moves more forecast dollars than a 30-point gap at Discovery.
What it usually means. Nobody has re-calibrated since the pipeline was built. The probabilities were a guess in year one and are now an assumption nobody remembers making. Once you have the history it is a two-hour fix, and the one that most often makes the weighted forecast reconcile to what closes.
5. Closed-won in the CRM versus invoiced by finance
What it is. Closed Won amount by close-date month for the last two quarters, set against what finance invoiced or booked for the same accounts in the same months. The variance is the size of the vocabulary gap between “won” in the CRM and “revenue” in finance.
HubSpot. CRM > Deals, filter Deal stage is Closed won and Close date within the last two quarters; export with Amount, Company name, Company domain and Close date. If the portal uses Quotes, add quote amount as a second column; that gap is the first place variance shows up.
Salesforce. Reports > New Report > Opportunities, filter Won equals True and Close Date within the last two quarters, columns Account Name, Amount, Close Date, Type. Export and match to the billing system on account and month, or on opportunity ID where the finance system carries one. Every unmatched row on either side is a finding.
The threshold. Variance above 5% of the period’s closed-won total that cannot be explained line by line. Explained variance (multi-year deals booked at total contract value in the CRM and recognised monthly by finance) is fine and should be written down once. Unexplained variance is what makes a board deck indefensible.
What it usually means. The amount field carries something other than first-year contract value, deals are marked won before signature, or won deals are edited after the fact. In the composite on our sample audit page, attribution was attached to only 23% of closed-won opportunities, a cousin of this problem: two numbers that never agreed because they were never computed on the same records.
What the five say together
If numbers 1 and 2 are bad and the rest are clean, the CRM has no stage discipline and the fix is definitions and exit rules, not tooling. If number 3 is bad on its own, the close date is a free field and needs a reason code. If number 4 is bad, the weighted forecast has never been calibrated and the fix is arithmetic. If number 5 is bad, marketing, sales and finance are using the same word for different things, and no report will reconcile until the definition is written down and enforced in the platform.
For the deck, one line each:
- Open deals with no close date or a past close date, as a share of open pipeline value.
- Open deals with no stage change in 90+ days, as a share of open pipeline value.
- This quarter’s deals already pushed at least once, and pushes per deal.
- Configured stage probability against realised win rate, last four quarters.
- Closed-won in the CRM against invoiced by finance, by month, variance explained line by line.
None of this needs a new tool, a warehouse, or write access. It needs a read-only user, two hours, and the row counts put in front of the people who own the fields. We have not seen a forecast reconcile to finance until the stage definitions were rewritten with sales in the room.
If you would rather have the five pulled by people who do this weekly, with the evidence exports attached and the fixes ordered by cost, that is the GTM Systems Audit: three weeks, read-only, from USD $1,500 up to 100k records, credited in full against a Systems Rescue Sprint or Custom Build within 30 days. The sample audit shows the deliverable before you spend anything, and the 60-point checklist covers the surfaces beyond these five. If a first call shows you don’t need one, we’ll say so.